Getting started with Cartridge application
The metrics module is tightly integrated with
the Cartridge framework.
To enable this integration, a permanent role called metrics has been introduced.
To enable this role, follow the steps below.
First, install the latest version of metrics. For details,
check the installation guide.
Also, you need to install the separate cartridge-metrics-role rock. To do this:
Add the
cartridge-metrics-rolepackage to the dependencies in the.rockspecfile:dependencies = { ... 'cartridge-metrics-role', ... }
Next, install the missing dependencies:
tt rocks make
# OR #
cartridge build
After the cartridge-metrics-role installation, enable this package in the list of roles in cartridge.cfg:
local ok, err = cartridge.cfg({
    roles = {
        ...
        'cartridge.roles.metrics',
        ...
    },
})
Then, configure the metrics module in either of two ways:
- add the
metricsconfiguration section to your cluster configuration; - specify the configuration in the separate
metrics.ymlfile.
In the configuration, specify the response format and the addresses at which the commands are available:
metrics:
  export:
    - path: '/path_for_json_metrics'
      format: 'json'
    - path: '/path_for_prometheus_metrics'
      format: 'prometheus'
    - path: '/health'
      format: 'health'
Learn more about Cartridge configuration.
Note
Instead of configuring the cluster configuration, you can also use the set_export command.
Now the commands’ data is accessible at the following addresses:
http://url:port/path_for_json_metrics
http://url:port/path_for_prometheus_metrics
http://url:port/health
where url:port – the address and Cartridge HTTP port of a specific instance of the application.
You can visualize the data in Grafana dashboard.
After the role has been initialized, the default metrics are enabled
and the global alias label is set.
Note
Since 0.6.1, the alias label value is set by the alias or instance_name
instance configuration option.
You can use the functionality of any metrics package.
To do this, get the package as a Cartridge service and call it with the require() like a regular package:
local cartridge = require('cartridge')
local metrics = cartridge.service_get('metrics')
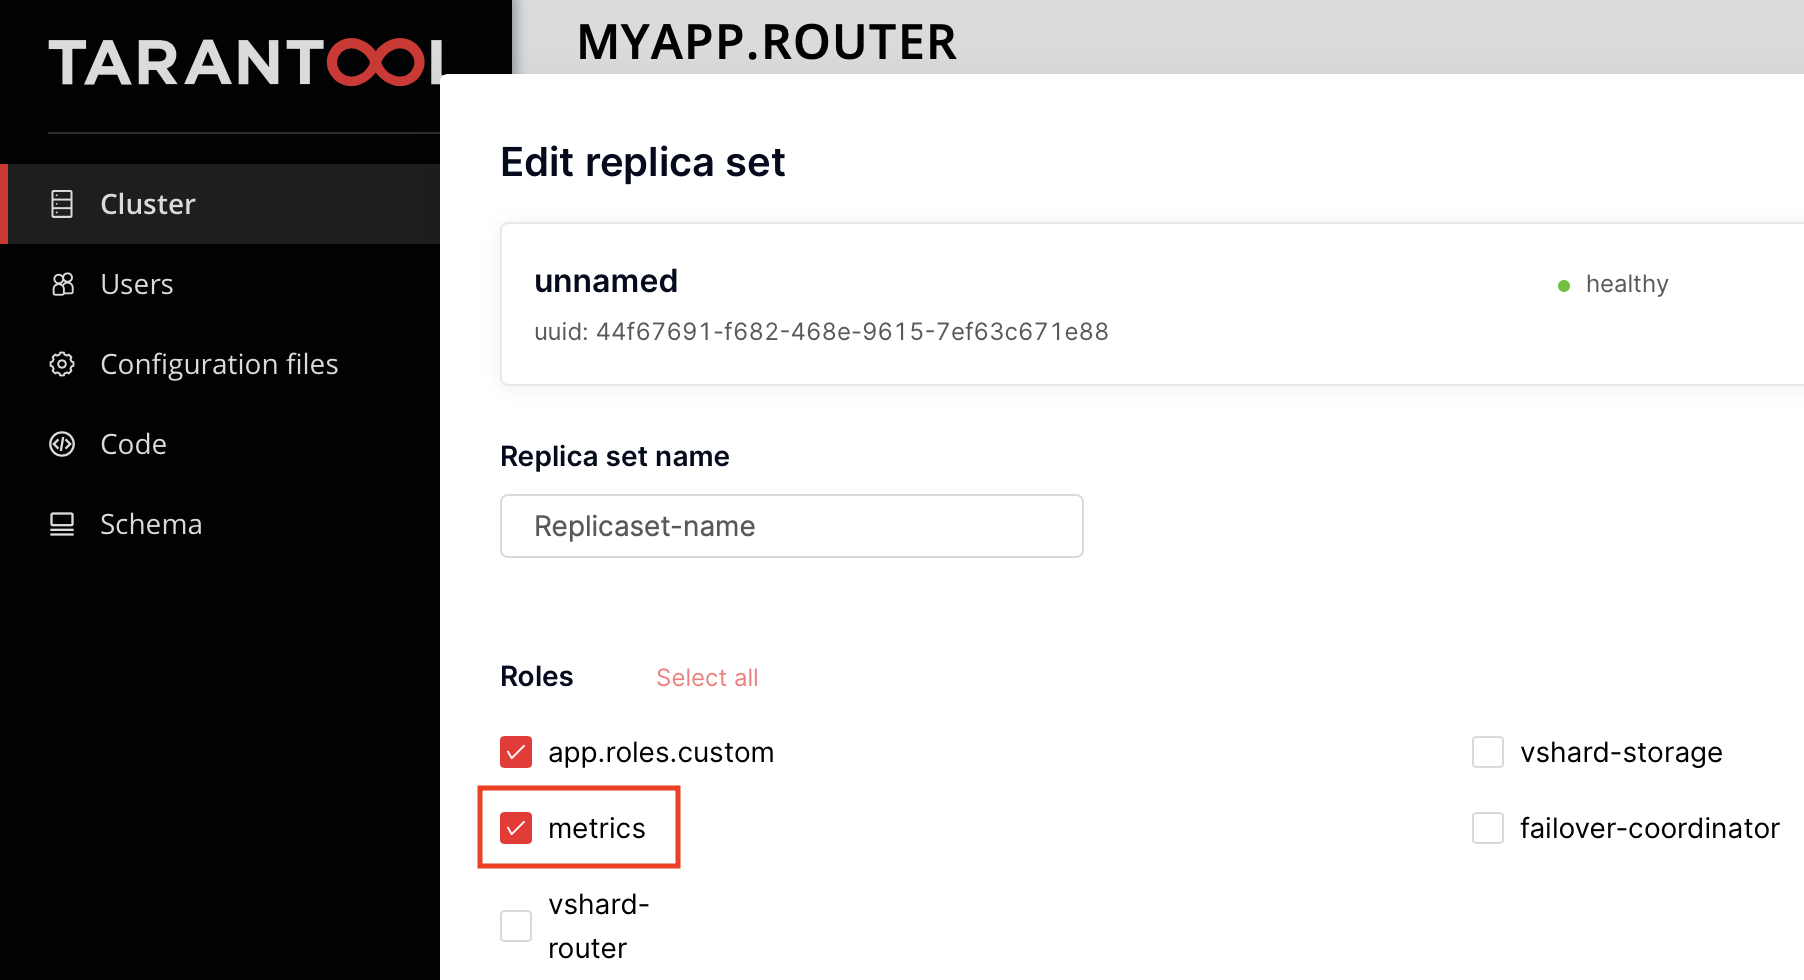
Since version 0.6.0, the metrics role is permanent and enabled on instances by default.
If you use an old version of metrics, you need to enable the role in the interface first:
You can connect the standard http_server_request_latency metric to your application’s HTTP API
commands. This metric records the number of invocations and the total execution time (latency) of
each individual command. To connect this, wrap each API handler with
the metrics.http_middleware.v1(...) function.
Example:
local cartridge = require('cartridge')
local server = cartridge.service_get('httpd') -- get the HTTP server module
local metrics = cartridge.service_get('metrics') -- get the module of metrics

local function http_app_api_handler(request) -- add test command
    return request:render({ text = 'Hello world!!!' })
end

local server = http_server.new('0.0.0.0', 8081)
server:route({path = '/hello'}, metrics.http_middleware.v1(http_app_api_handler))
server:start()
When calling the cartridge.service_get('metrics') command as an application (usually in a router),
add a dependency of this role on the role of metrics:
return {
    ...
    dependencies = {
        ...
        'cartridge.roles.metrics',
    }
}
Now after the HTTP API calls hello at http://url:port/path_for_json_metrics,
new data on these calls is available:
{
    "label_pairs": {
        "path": "/hello",
        "method": "ANY",
        "status": 200,
        "alias": "my-tnt-app"
    },
    "timestamp": 1679668258972227,
    "metric_name": "http_server_request_latency_count",
    "value": 9
},
{
    "label_pairs": {
        "path": "/hello",
        "method": "ANY",
        "status": 200,
        "alias": "my-tnt-app"
    },
    "timestamp": 1679668258972227,
    "metric_name": "http_server_request_latency_sum",
    "value": 0.00008015199273359
},
The default type for this metric is histogram. However,
it’s recommended to use the summary type instead.
Since Tarantool Cartridge
2.4.0, you can set a zone for each instance in the cluster. When a zone is set, all the metrics on the instance receive thezonelabel.You can set custom global labels with the following configuration:
metrics:
  export:
    - path: '/metrics'
      format: 'json'
  global-labels:
    my-custom-label: label-value
Another option is to invoke the
set_default_labelsfunction ininit.lua:local metrics = require('cartridge.roles.metrics') metrics.set_default_labels({ ['my-custom-label'] = 'label-value' })
You can use the configuration below to choose the default metrics to be exported. If you add the
includesection, only the metrics from this section will be exported:metrics: export: - path: '/metrics' format: 'json' # export only vinyl, luajit and memory metrics: include: - vinyl - luajit - memory
If you add the
excludesection, the metrics from this section will be removed from the default metrics list:metrics: export: - path: '/metrics' format: 'json' # export all metrics except vinyl, luajit and memory: exclude: - vinyl - luajit - memory
For the full list of default metrics, check the API reference.
By default, the response of the health command contains a status code of
200– if everything is okay,500– if the instance is unhealthy.
You can set your own response format in the following way:
local health = require('cartridge.health')
local metrics = cartridge.service_get('metrics')

metrics.set_health_handler(function(req)
    local resp = req:render{
        json = {
            my_healthcheck_format = health.is_healthy()
        }
    }
    resp.status = 200
    return resp
end)